Icons & Infographics

Statistical Infographics
This infographic was created as part of a series, used for both web and print applications, depicting disaster statistics around the globe. Created with Adobe Illustrator.
Signage System Icons
Depicted here are just a few of the icons used to represent the different modules available in this digital signage system layout. Created with Adobe Illustrator.

Informational Infographics
This infographic was designed as part of an awareness campaign to assist commuters with alternate modes of transportation during the Metrorail SafeTrack initiative. Created with Adobe Illustrator.
TP Link Tether App Icons
I designed six additional icons as an exercise, in an effort to challenge myself to see if I could both; match the existing style, (already established by the manufacturer) and to determine whether I could work with that style to generate the newly proposed web client device icons. The bottom six are the proposed icons. Created with Adobe Illustrator and Photoshop.
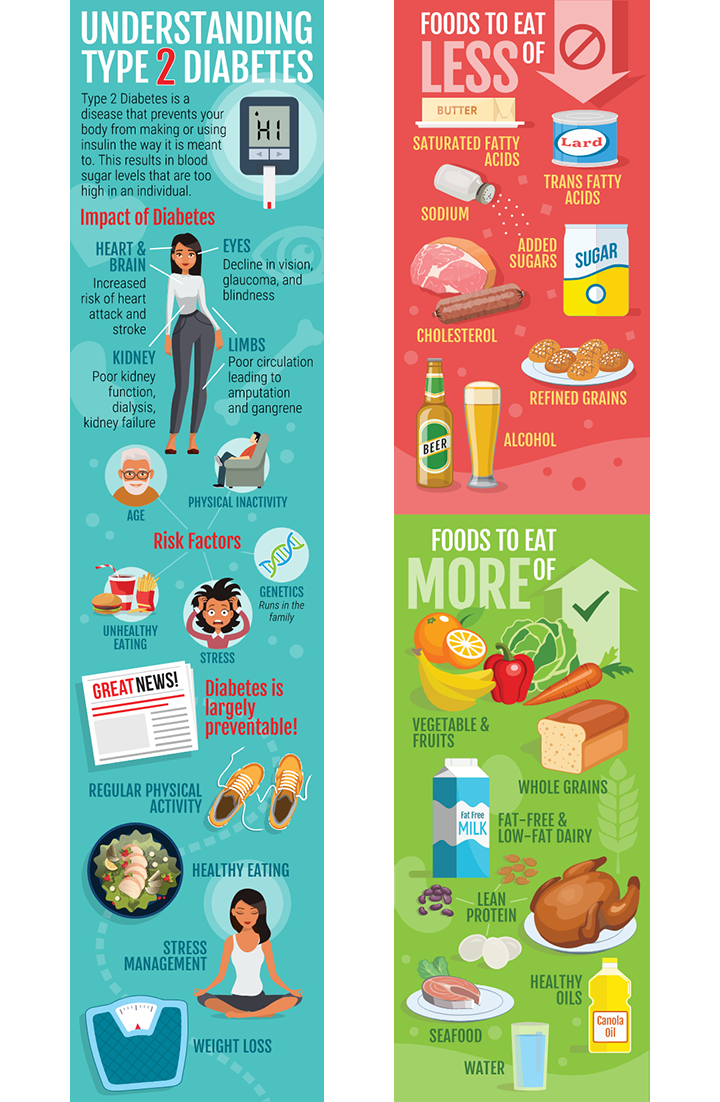
Type 2 Diabetes Infographics
I created these infographics as part of a mobile web app designed to provide people in the rural Hispanic community knowledge of type II diabetes and methods for prevention. Created with Adobe Illustrator, using some modified stock illustrations combined with original artwork.
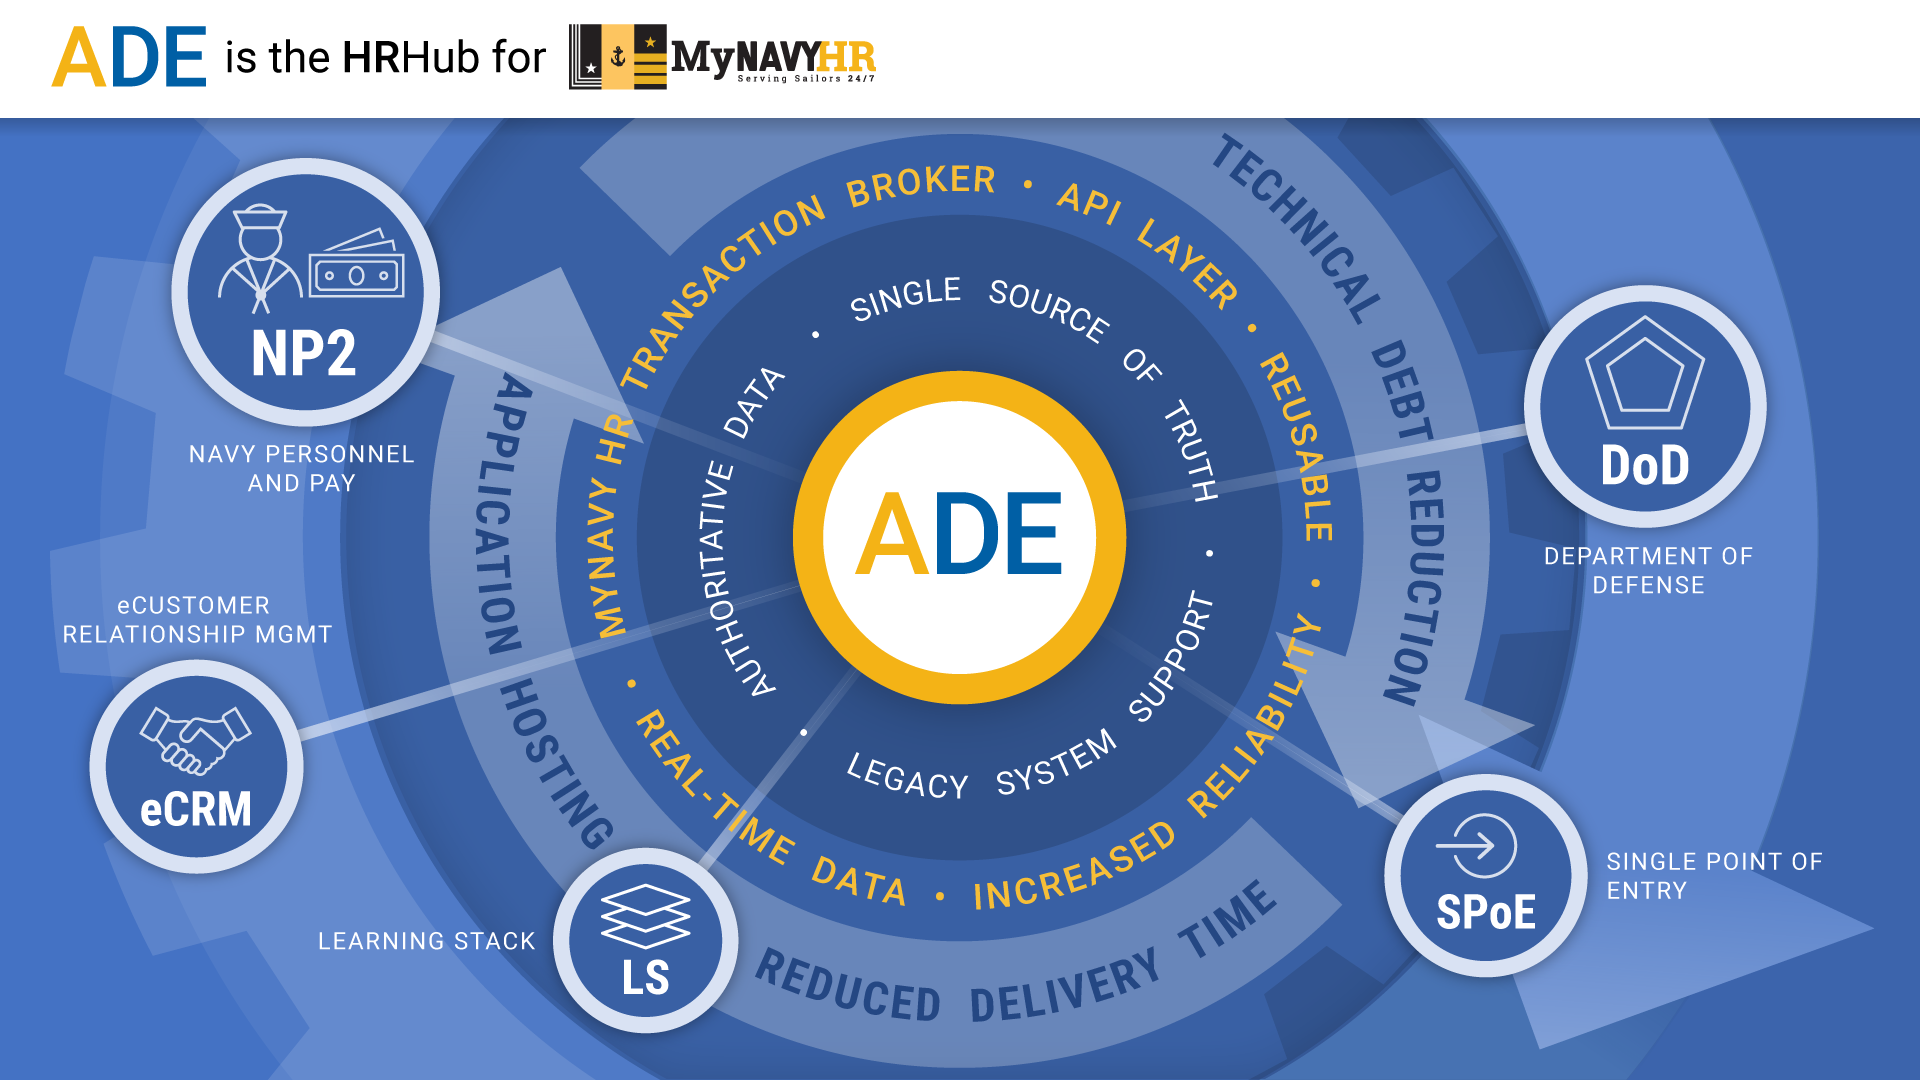
ADE Data Exchange Broker Infographic
I collaborated with our Information Systems Managers to realize this presentation infographic, illustrating the many assets which establish the Authoritative Data Environment (ADE) as the Data Exchange Broker for the MyNAVY HR organization. Created with Adobe Illustrator and Photoshop.
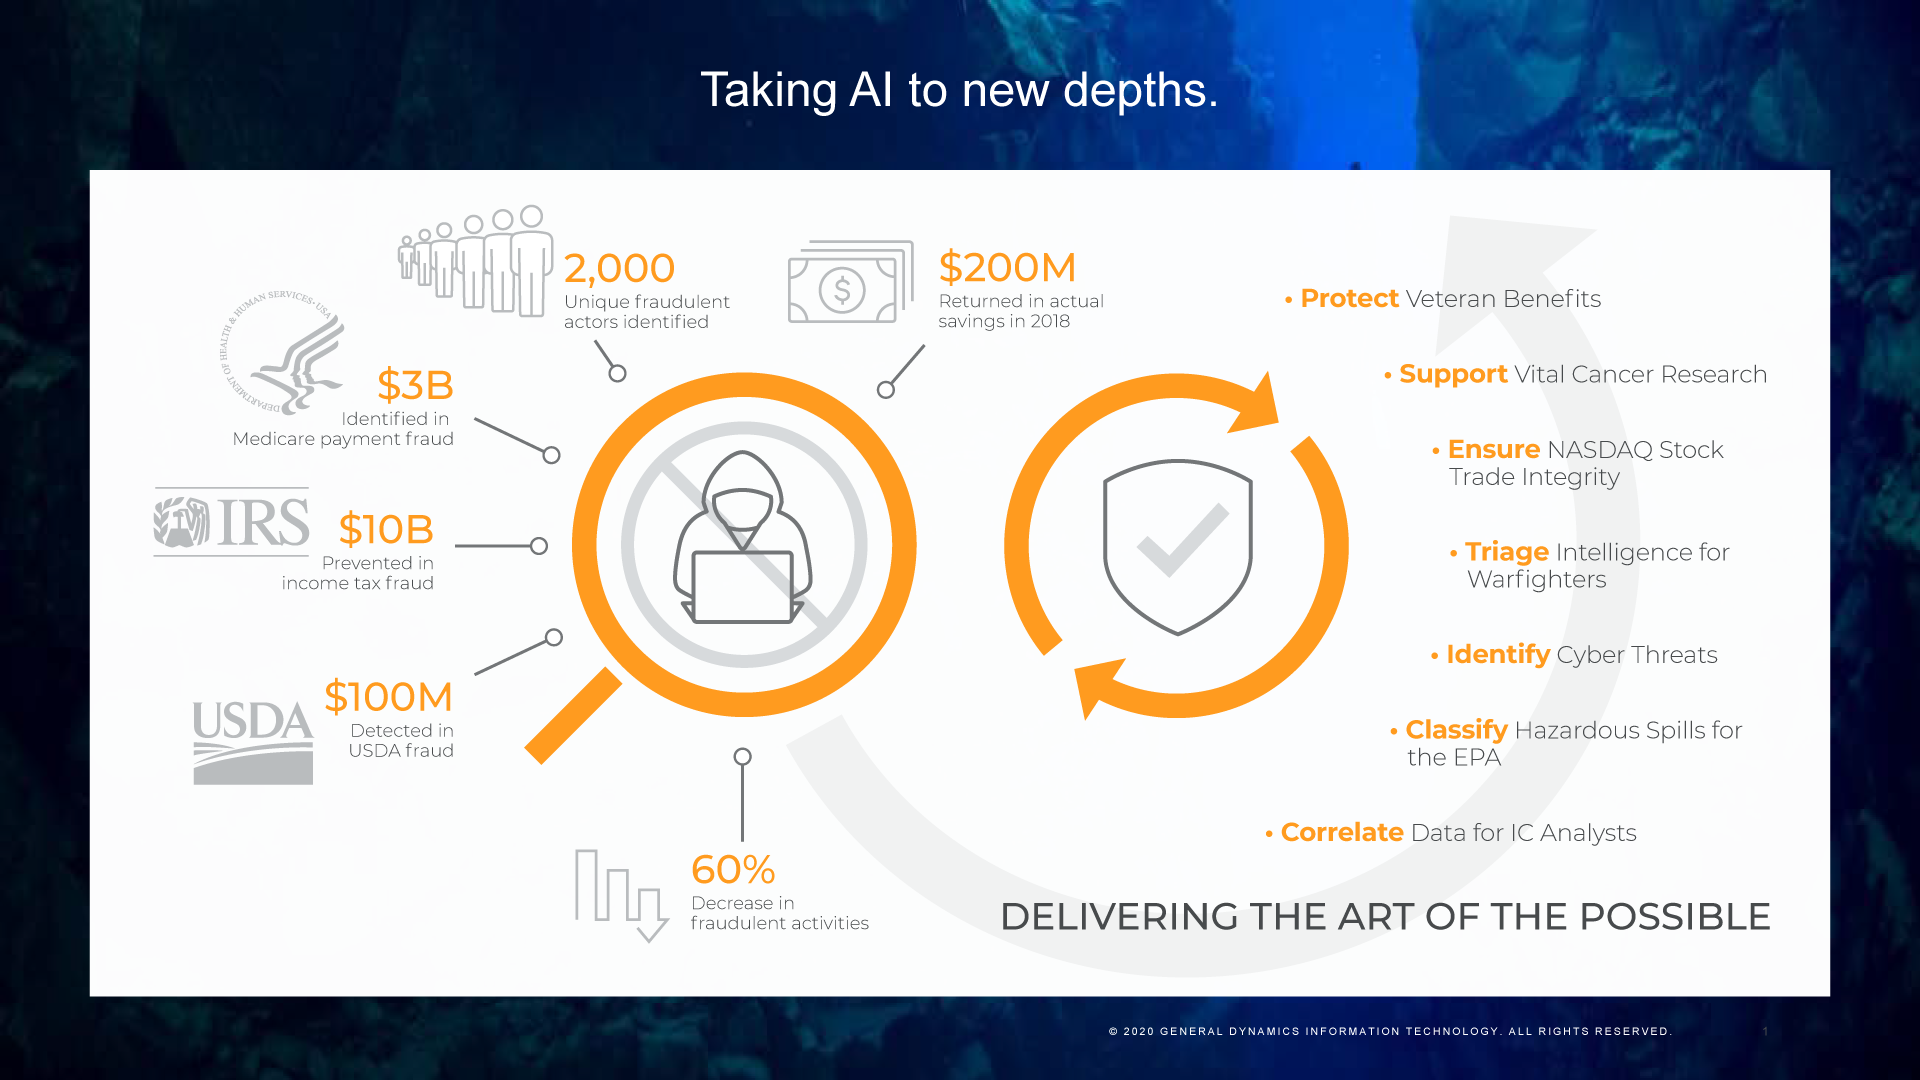
AI ML Infographic
This infographic mock-up illustrates how GDIT has leveraged Artificial Intelligence Machine Learning (AI/ML) to maintain stability and security for our stakeholders. Created with Adobe Illustrator.
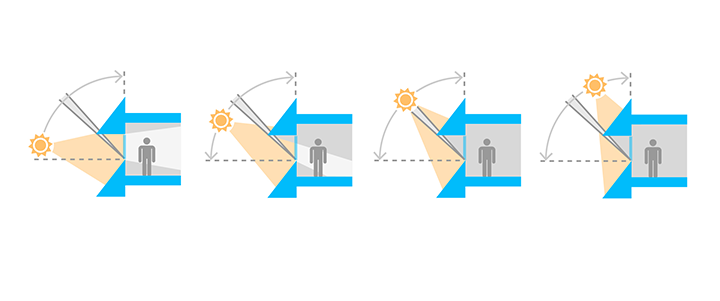
Technical Iconographic Diagram
I designed this iconographic diagram, depicting the various positions of the sun throughout the year, showing how AlexRenew's new LEAD certified building uses solar awnings to take advantage of sun and shade to save on energy expenses. Created with Adobe Illustrator.
Weather Icons
I created this simple, consistent, and easy to read set of weather icons to be used in a digital signage system. Created with Adobe Illustrator.